NEW PAPER: Marion Island killer whales are more social when there's more food
/The Marion Island Marine Mammal Programme (MIMMP) continuously monitors the killer whale population at Marion Island, and since 2006 (when the current photoidentification catalogue was started) 69 individuals have been observed, of which 21 are calves born during this period.
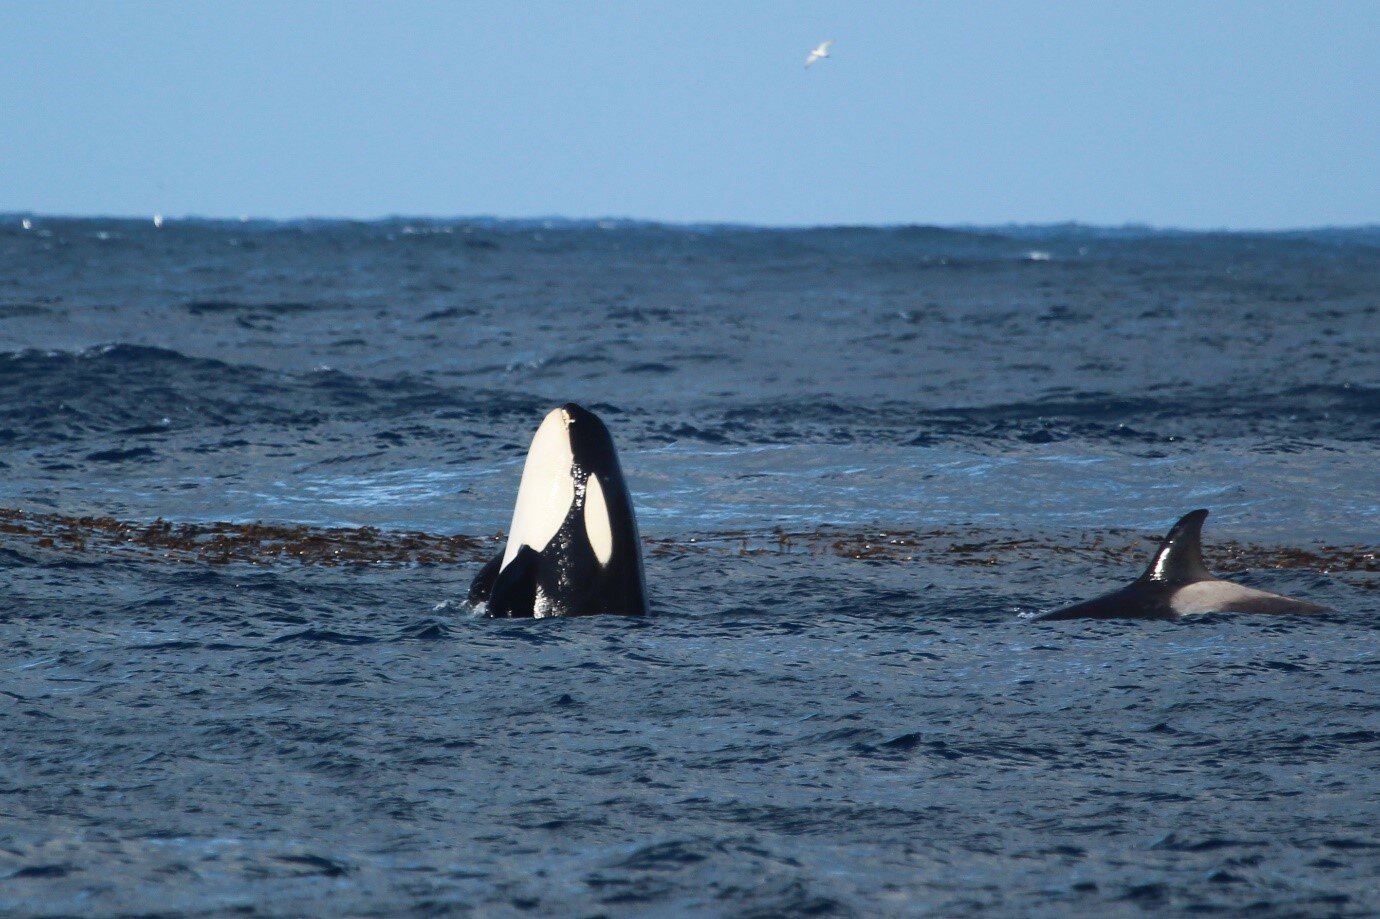
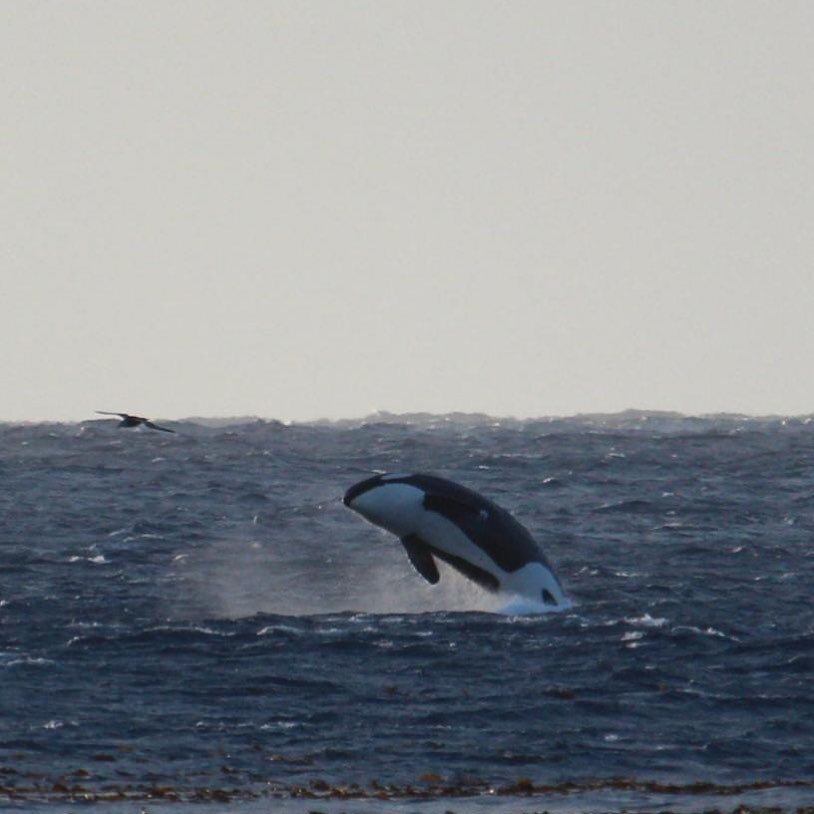
An adult female (M002) spy-hops after a successful king penguin hunt at Ship’s Cove. PHOTO CREDIT: Rowan JordaaN
A new study led by MIMMP PhD student, Rowan Jordaan, made use of this long-term data in a recently published article in Animal Behaviour. They used nearly 90 000 photographs (from 4739 sightings over 12 years) to assess the social structure of killer whales at sub-Antarctic Marion Island across different periods of the year corresponding to fluctuations in prey availability: southern elephant seals, sub-Antarctic fur seals, king and macaroni penguins are most abundant between September to December (“peak”) and least abundant between January to August (“off-peak”). Analyses showed significant differences between various measures of social structure between these peak and off-peak periods.
Killer whales were more social during the peak period when there was more prey available, by exhibiting higher probabilities of socialising with other individuals, forming stronger associations, showing less division in the population and social groups consisting of more individuals. As a whole, the social network during the peak period was compact with very short distances between all individuals. In contrast, killer whales were less sociable during the off-peak periods as individuals formed smaller groups that were less likely to socialise with others.

FIGURE FROM JORDAAN ET AL. 2021. Network plots for Marion Island killer whales over (a) all peak periods (September - December) and (b) all off-peak periods (January - August) during 2006- 2018. Each node (coloured circle) represents an individual killer whale and each vertex/edge (line between two nodes) represents the association between two killer whales. Numbers in nodes indicate the unique ID code for each individual. Size of nodes and thickness of edges are a direct representation of how social individuals are.Individuals were grouped into social units, represented by different colours
These results are typical of a process called fission-fusion, which occurs in a population when individuals leave social groups to form smaller groups (fission) or come together to form larger groups (fusion). For killer whales at Marion Island, this balance appears to shift during the year in relation to the amount of prey available in an effort to reduce competition and to maximise the net energy intake per individual, ultimately benefitting the population as a whole. Similar responses to changes in prey availability have been observed in various animal societies such as wolves, whales, lions, wild dogs and spotted hyenas.
Well done to Rowan and colleagues on this publication, which provides further support to the idea that prey availability is an important determinant of social structure in social predators.
Read the full article HERE.